Visualizing Object Categories in Images with Color Legends #
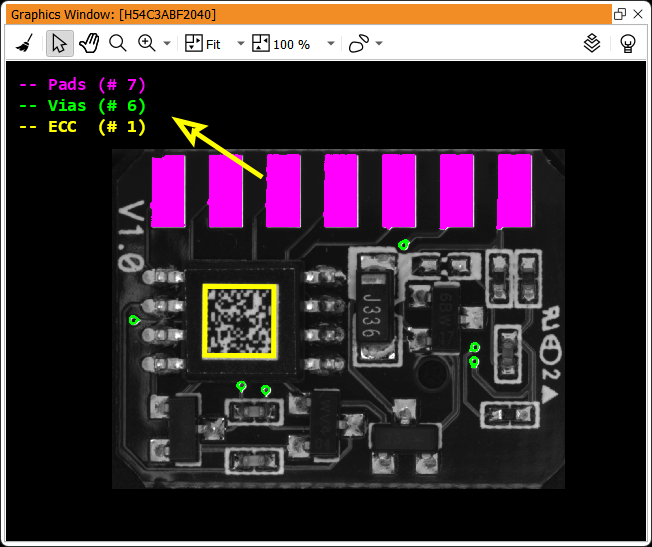
In this post, we aim to enhance image-based object recognition results through intuitive visualizations. Specifically, we want to assign a distinct color to each category of object detected in an image of a PCB - such as "pads", "vias", or "datacodes" - and overlay these colored masks onto the original image. This not only highlights the presence and location of objects but also differentiates between categories at a glance.
To make the visualization interpretable, we also include a color legend. This legend maps each color used in the overlay to its corresponding object category, allowing viewers to quickly understand which regions of the image belong to which class. The result is a clear, informative visual summary that supports both qualitative assessment and presentation of object detection or segmentation results.
In the end, this Graphics window will be the intented output:
Example script #
Let's take the corresponding script as an example:
** colored_text_overlay_00_goal.hdev

** init
dev_update_off ()

** constants
ColorPads := 'magenta'
ColorVias := 'green'
ColorEcc  := 'yellow'

* read and display example image
read_image (Image, 'printer_chip/printer_chip_01')
dev_open_window_fit_image (Image, 0, 0, 640, -1, WindowHandle)
set_display_font (WindowHandle, 16, 'mono', 'true', 'false')
dev_set_part (-310, -375, 1384, 1885)
dev_display (Image)

* pads
threshold (Image, RegionLight, 140, 255)
connection (RegionLight, ConnectedRegions)
select_shape (ConnectedRegions, RegionsPads, 'area', 'and', 20000, 'max')
count_obj (RegionsPads, NumPads)
dev_set_color (ColorPads)
dev_display (RegionsPads)

* vias
select_shape (ConnectedRegions, RegionsVias, ['area', 'holes_num', 'area_holes'], 'and', [500, 1, 100], [1000, 1, 500])
select_shape (RegionsVias, RegionsVias, 'area_holes', 'and', 100, 1000)
count_obj (RegionsVias, NumVias)
dev_set_color (ColorVias)
dev_display (RegionsVias)

* data code
create_data_code_2d_model ('Data Matrix ECC 200', [], [], DataCodeHandle)
find_data_code_2d (Image, ContoursEcc, DataCodeHandle, [], [], __, DecodedDataStrings)
count_obj (ContoursEcc, NumEcc)
dev_set_color (ColorEcc)
dev_set_line_width (5)
dev_display (ContoursEcc)
Now, we can add the following three lines of code to show an informative Color Legend. We'll explain how this works below:
* show color legend
dev_disp_text (['-- Pads (# ' + NumPads + ')'],        'window', 'top', 'left', ColorPads, 'box', 'false')
dev_disp_text (['', '-- Vias (# ' + NumVias + ')'],    'window', 'top', 'left', ColorVias, 'box', 'false')
dev_disp_text (['', '', '-- ECC  (# ' + NumEcc + ')'], 'window', 'top', 'left', ColorEcc,  'box', 'false')
Basics of dev_disp_text #
To understand the three lines of code above, let's start with the basics of dev_disp_text:
dev_disp_text can be used to display text in the current Graphics window, mainly during development within HDevelop or when using a redirection of drawing operations in the host application.
Its sibling disp_text works similarly but operates on native windows opened via open_window.
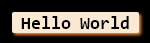
A simple example shows the string "Hello World" in the top-left corner of the current window. The font can be set with set_display_font. The font color is black (explicit parameter) on an (implicit) light orange background with an orange shadow:
dev_get_window (WindowHandle)
set_display_font (WindowHandle, 16, 'mono', 'true', 'false')
dev_disp_text ('Hello World', 'window', 'top', 'left', 'black', [], [])
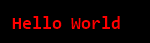
The text color is specified as parameter Color either as text ('red') or in hexadecimal web notation ('#FF0000'). We disable the box with the generic parameter box: 'false':
dev_disp_text ('Hello World', 'window', 'top', 'left', 'red', 'box', 'false')
Multiple colors #
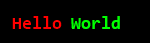
It’s not possible to change font details like color within a single dev_disp_text call. But as we use a monospaced font (-> set_display_font), we can use two calls of dev_disp_text with two different parameterizations. The trick is to align the output of the second call to dev_disp_text to the first call be using the same amount of spaces.
For example, to make "Hello" red and "World" green:
dev_disp_text ('Hello      ', 'window', 'top', 'left', 'red', 'box', 'false')
dev_disp_text ('      World', 'window', 'top', 'left', 'green', 'box', 'false')
You can also align multi-line text using tuples. The trick is to add an empty string at the beginning to move the second line down:
dev_disp_text ('Hello', 'window', 'top', 'left', 'red', 'box', 'false')
dev_disp_text (['', 'World'], 'window', 'top', 'left', 'green', 'box', 'false')

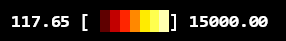
LUT (Lookup Table) Visualization #
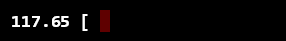
This multi-color trick enables other useful overlays - for example, a LUT with min and max value indications. Using Row := 'top', Column := 'left' pins the overlay to the upper-left corner, even when the image is moved.
** constants
UnicodeFullBlock := chrt(0x2588)  // FULL BLOCK
TextColor := 'white'

** init
dev_update_off ()
dev_get_window (WindowHandle)
set_display_font (WindowHandle, 16, 'mono', 'true', 'false')

** generate a sample image
gen_disc_se (Image, 'byte', 128, 128, 255)
convert_image_type (Image, Image, 'real')
scale_image (Image, ImageScaled, 15000 / 255.0, 0)

** visualize the grayvalue data with LUT 'temperature'
dev_set_lut ('temperature')
dev_display (Image)

min_max_gray (ImageScaled, ImageScaled, 0, Min, Max, Range)
Colors := ['#000000', '#5F0000', '#C20000', '#FF2500', '#FF8800', '#FFEB00', '#FFFF4E', '#FFFFB1']

Text := Min$'.2f' + ' ['
dev_disp_text (Text, 'window', 'top', 'left', TextColor, ['box'], ['false'])
Step 1 #

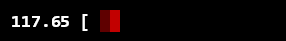
Step 2, 3, … #
Indent := sum(gen_tuple_const(strlen(Text), ' '))
for IndexColor0 := 0 to |Colors|-1 by 1
    Text := UnicodeFullBlock
    dev_disp_text (Indent + Text, 'window', 'top', 'left', Colors[IndexColor0], ['box'], ['false'])
    Indent := Indent + ' '
endfor
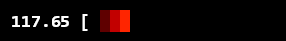
Last step #
Text := '] ' + Max$'.2f'
dev_disp_text (Indent + Text, 'window', 'top', 'left', TextColor, ['box'], ['false'])
Summary #
We have demonstrated the use of dev_disp_text for developing informative color overlays and legends, along with several useful tricks for multi-color and multi-line display. These techniques are especially helpful for visualizing object categories and lookup tables during algorithm development.
Feel free to contact us if you have any questions or need support with your own project.